When students first learn about data and statistics, two terms often cause confusion: mean and median.
Both are used to describe numbers, and both are sometimes called “averages.” Because of this, many learners think they are the same thing.
However, mean and median are different, and each one tells a different story about the data. The confusion usually happens because:
- Both are used to summarize data
- Both are taught together
- Both help describe “center” values
In this guide, you will understand the difference between mean and median in a very simple way, with clear steps, examples, and comparisons.
Quick Answer (Simple Overview)
- Mean = Add all numbers and divide by how many numbers there are (average).
- Median = The middle number when data is arranged in order.
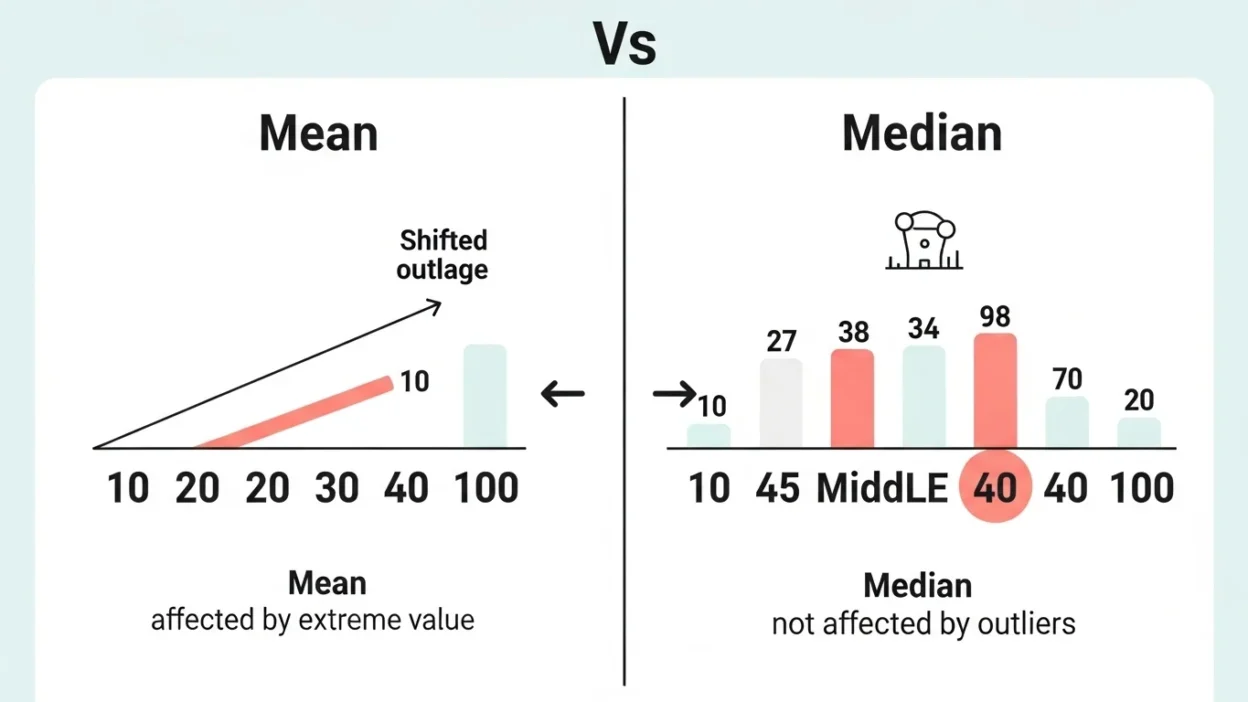
- Mean is affected by very large or very small values.
- Median is not affected by extreme values.
- Use mean for balanced data.
- Use median for uneven or skewed data.
Step by Step Understanding of Mean
The mean (average) uses all values in a dataset.
How to calculate mean:
- Add all the numbers
- Count how many numbers there are
- Divide the total by the count
Example 1:
Numbers: 10, 20, 30, 40
Step 1: Add them
10 + 20 + 30 + 40 = 100
Step 2: Count numbers
There are 4 numbers
Step 3: Divide
100 ÷ 4 = 25
✅ Mean = 25
👉 Important: Every number affects the mean.
Step by Step Understanding of Median
The median is the middle value in a sorted list.
How to calculate median:
- Arrange numbers from smallest to largest
- Find the middle value
Example 2:
Numbers: 10, 20, 30, 40, 50
Middle value = 30
✅ Median = 30
When there are two middle numbers:
Example: 10, 20, 30, 40
Middle numbers = 20 and 30
Median = (20 + 30) ÷ 2 = 25
✅ Median = 25
👉 Important: Median depends on position, not all values.
Side by Side Comparison Using the Same Data
Let’s take one dataset and calculate both mean and median.
Dataset:
10, 20, 30, 40, 100
Step 1: Mean Calculation
10 + 20 + 30 + 40 + 100 = 200
200 ÷ 5 = 40
✅ Mean = 40
Step 2: Median Calculation
Sorted data: 10, 20, 30, 40, 100
Middle value = 30
✅ Median = 30
What does this show?
- The number 100 is much larger than others
- It increases the mean
- But the median stays in the center
👉 This is the key difference between mean and median.
Why Mean Changes but Median Stays Stable
- Mean uses all values, so extreme values (called outliers) affect it
- Median only looks at the middle position, so outliers do not affect it
Example:
Numbers: 5, 6, 7, 8, 1000
- Mean becomes very large because of 1000
- Median remains 7
👉 This is why median is better for uneven data.
Comparison Table (Easy to Scan)
| Feature | Mean | Median |
| Definition | Average of all numbers | Middle value of ordered data |
| Calculation | Add and divide | Sort and find center |
| Uses all values | Yes | No |
| Affected by extreme values | Yes | No |
| Best for | Balanced data | Skewed data |
| Sensitivity | High | Low |
When to Use Mean vs Median
Use Mean when:
- Data is evenly spread
- There are no extreme values
- You want a general average
Example:
Marks of students in a class where all scores are similar.
Use Median when:
- Data has very high or very low values
- Data is uneven (skewed)
- You want a typical central value
Example:
Income data where a few people earn much more than others.
Real Life Examples Explained Clearly
1. Exam Scores
Scores: 50, 55, 60, 65, 100
- Mean is higher due to 100
- Median remains close to most students’ scores
👉 Median gives a more realistic picture of the class.
2. Salaries
Salaries: 20k, 25k, 30k, 35k, 200k
- Mean increases because of 200k
- Median reflects a normal worker’s salary
👉 Median is more meaningful here.
3. House Prices
Prices: 100k, 120k, 130k, 140k, 500k
- Mean is influenced by the expensive house
- Median shows a more typical house price
4. Social Media Followers
Followers: 100, 200, 300, 400, 10,000
- Mean becomes high due to 10,000
- Median remains closer to normal users
5. Daily Pocket Money
Pocket money: 50, 60, 70, 80, 500
- Mean increases because of 500
- Median shows what most people actually receive
Common Mistakes Students Make
- Forgetting to arrange numbers before finding median
- Confusing mean with median
- Not dividing when calculating mean
- Ignoring the effect of outliers
- Using mean in situations where median is better
- Forgetting to average two middle numbers in even datasets
Simple Rule of Thumb
Use this easy guide to decide:
- If the data looks balanced → use mean
- If the data has extreme values → use median
👉 This simple rule helps in exams and real life problems.
Mean Median Mode Difference (Quick Understanding)
- Mean = Average of all values
- Median = Middle value
- Mode = Most repeated value
Together, they describe different aspects of data.
Short Learning Section for Beginners
Key Points to Remember:
- Mean uses all numbers
- Median uses the middle number
- Mean is sensitive to extreme values
- Median is stable even with extreme values
- Median is better for skewed data
- Mean is better for balanced data
Practice Tip:
Always check your data first:
- Is it balanced? → Mean
- Is it uneven or has outliers? → Median
FAQ (Frequently Asked Questions)
1. What is the main difference between mean and median?
Mean is the average of all numbers, while median is the middle number in a sorted list.
2. Why does mean change with extreme values?
Because mean includes all numbers, very large or small values affect the total significantly.
3. Why is median not affected by outliers?
Median only depends on the position of numbers, not their size.
4. How do I quickly find the median?
Sort the numbers and pick the middle one. If there are two middle numbers, average them.
5. Which is more accurate, mean or median?
Neither is always more accurate. It depends on the type of data.
6. Can mean and median be equal?
Yes, when the data is evenly distributed and balanced.
7. What happens if data is skewed?
Mean may be misleading, so median is usually a better choice.
8. What is the easiest way to remember the difference?
Mean uses all values, median uses the middle value.
Conclusion
Understanding the difference between mean and median is an important step in learning basic statistics.
The mean gives an overall average by using all numbers, while the median shows the middle value and is not affected by extreme values.
If your data is balanced, the mean works well. If your data includes outliers or is uneven, the median gives a more accurate picture.

Daniel Matthew is a passionate visionary who believes in creativity, purpose, and innovation. With a focus on growth and authenticity, he turns every idea into meaningful impact.